

Japan is a big SaaS market, but the wrong first niche can slow you down for months. If I had to boil this guide down to one point, it would be this: I would pick a narrow Japan niche only when demand is clear, the buyer is easy to name, localization work stays limited, and the sales path fits how Japanese teams buy software.
Here’s the short version:
- Japan’s SaaS market is about $13.8 billion in 2026 and is projected to reach $38.1 billion by 2035
- 65% of Japanese B2B buyers won’t look at products without Japanese-language support
- About 70% of B2B SaaS sales in Japan go through partners
- CRM is the largest category
- HR tech is growing the fastest
- Productivity and workflow tools are often the easiest first wedge because setup is lighter and buyer education is lower
- Mid-market buyers are often the best first target because demand is high and procurement is less rigid than in large enterprises
What I’d focus on first:
- Score each niche on pain, budget, proof, localization load, channel access, implementation risk, expansion path, and local proof
- Check B2B buying patterns and buyer pull with Japanese interviews, review sites, search terms, and partner feedback
- Pick one use case, one buyer, and one route to a first local reference
- Localize only what helps close deals first: UI, pricing page, sales docs, onboarding, JPY billing, and bank transfer support
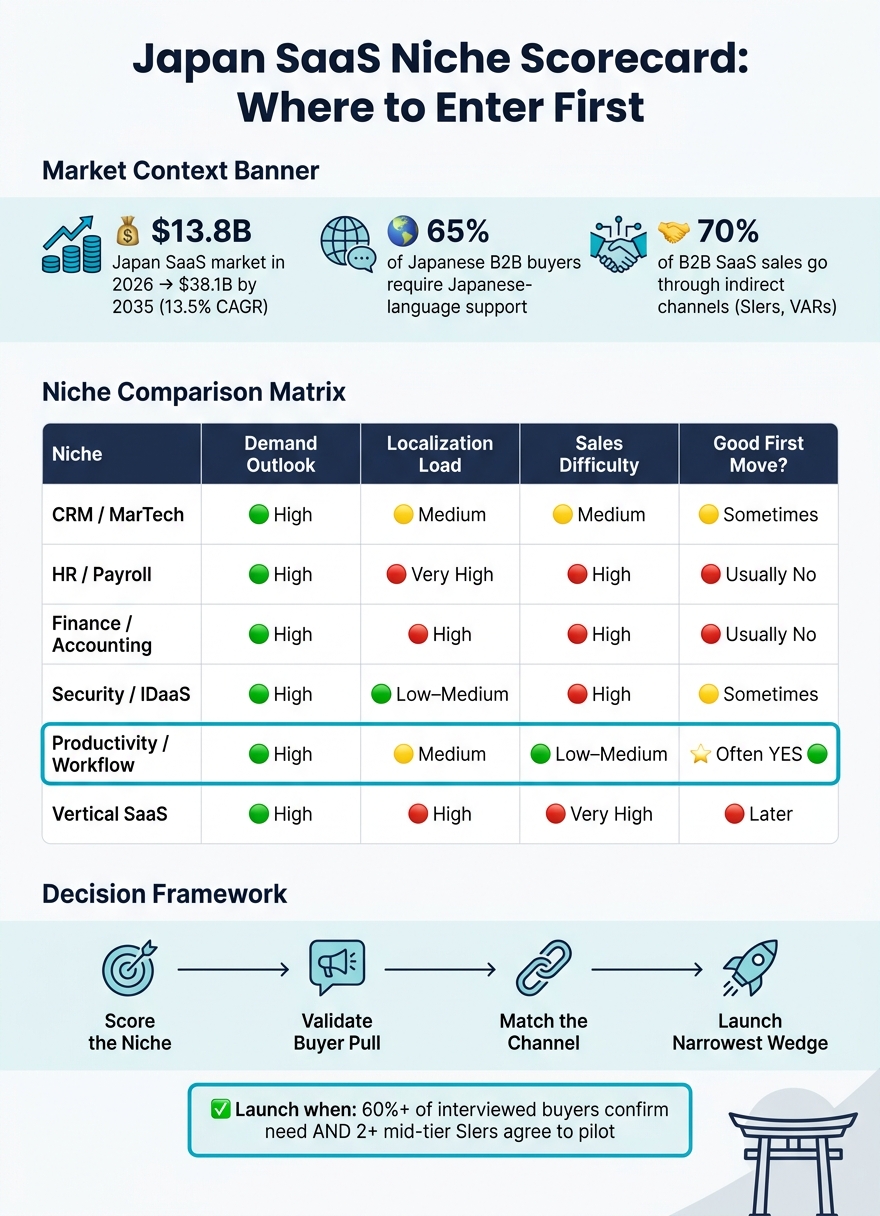
Japan SaaS Niche Comparison: Demand, Localization & Sales Difficulty
Quick comparison
| Niche | Demand outlook | Localization load | Sales difficulty | Good first move? |
|---|---|---|---|---|
| CRM / MarTech | High | Medium | Medium | Sometimes |
| HR / Payroll | High | Very high | High | Usually no |
| Finance / Accounting | High | High | High | Usually no |
| Security / IDaaS | High | Low to medium | High | Sometimes |
| Productivity / Workflow | High | Medium | Low to medium | Often yes |
| Vertical SaaS | High | High | Very high | Later |
My takeaway: I would start with the smallest wedge that can win local trust fast, not the biggest market on paper. That means looking for a niche with clear pain, a known budget owner, low product change, and a direct path to a Japanese case study.
That’s the lens I’d use for the rest of this guide.
sbb-itb-a752276
Japan SaaS Market Overview and Niche Landscape
Japan’s SaaS market is estimated at $13.8 billion in 2026 and projected to hit $38.1 billion by 2035, which works out to a 13.5% CAGR. That’s a big market. But size alone doesn’t tell you where to go first.
The smarter move is to sort niches by structure and buyer fit, then decide which ones deserve a closer look.
A simple way to read the market is through three lenses. Horizontal SaaS covers broad business functions used across many industries, like CRM, HR, finance, and productivity software. Vertical SaaS focuses on one industry, such as manufacturing, construction, or logistics. Workflow tools handle a specific operational task inside a larger software stack, like digital approvals, invoice processing, or document routing.
Company size changes the picture too. Enterprise buyers tend to care most about security, compliance, integration, and vendor credibility. Mid-market buyers usually want clear productivity gains and a product they can roll out fast. SMBs care more about price and ease of adoption, and they often come with lighter procurement but more churn risk. That’s why it helps to compare niches by buyer reality, not just by product label.
How to Group Japan SaaS Niches by Category and Buyer
In Japan, it’s not enough to tag a niche by category. You need to know who owns the budget, who signs off, and who pushes the deal forward day to day. Those people are often not the same person.
Approval chains can be long. In many cases, the team using the product is not the team with the final say.
CRM and marketing automation tools usually involve sales and marketing leaders, but IT often has the final word on integrations. HR and payroll tools tend to sit with HR leaders and payroll administrators. Finance and accounting software usually needs CFO approval and must get through tax and invoicing checks. Security software is often led by IT and risk teams, with procurement and legal joining in on larger deals. Manufacturing and logistics tools are closer to operations leaders and plant managers, and some vertical SaaS products can even move ahead without central IT if a business unit lead has enough authority.
| Category | Primary Buyer | Budget Owner | Procurement Complexity |
|---|---|---|---|
| CRM / Marketing Automation | Sales/Marketing Ops | Head of Sales / CMO | High – integration required |
| HR Tech / Payroll | HR Manager, Payroll Administrator | HR Director / Finance | High – compliance-heavy |
| Finance / Accounting | Finance Manager | CFO | High – tax and invoicing rules |
| Security / IDaaS | IT Manager, Security Ops | CIO / CISO | High – security review |
| Manufacturing / Logistics | Operations, Plant Manager | Operations or Business Unit Lead | High – legacy integration |
| Productivity / Workflow | Team Leads, Process Owners | Department Leader or Dept. Manager | Low to Medium |
This buyer map is the first input to the scoring model in the next section.
Early Demand Signals That Justify Deeper Research
Some niches look great in a spreadsheet and still turn out to be a slog. Before you spend time on deep market work, look for signs that buyers already know the problem and are trying to fix it.
The strongest signals are pretty practical:
- Inbound interest from Japanese buyers
- Low buyer education needed before purchase
- APAC proof that the core value proposition works with localization
If you already have traction in Singapore, Australia, or with multinational teams serving Japan, that matters. It suggests your value proposition may transfer with localization instead of needing a full rebuild. That’s a big difference.
Local review sites such as ITreview and BOXIL are also useful starting points. One source says 43% of SME SaaS purchases in Japan originate from these sites.
Market Size, Growth, and Adoption Difficulty by Segment
Looking at market size by itself can send you in the wrong direction. A big segment with slow procurement, heavy localization, and messy integration needs may be a weaker first move than a smaller segment where buyers move fast and the product needs only minor changes.
Three filters matter most here: market potential, growth rate, and adoption difficulty.
Market potential is about how many good-fit accounts exist and how much revenue the segment can support. Growth rate tells you whether the category is moving fast enough to justify entering now. Adoption difficulty covers the work needed around localization, integration, and procurement.
CRM is now the largest SaaS category in Japan, while HR tech is the fastest-growing segment. That said, HR comes with very heavy localization work because Japan’s labor and payroll rules are complex. Security is also growing fast and usually needs less localization, but sales cycles are long because IT and risk teams do deep audits. Productivity and workflow tools often land in a sweet spot: moderate localization needs, faster setup, and a pain point that buyers can understand without a long internal education cycle.
| SaaS Niche | Market Potential | Growth Outlook | Localization Intensity | Sales Complexity |
|---|---|---|---|---|
| CRM / MarTech | High | Strong (13.5% CAGR) | Moderate | Moderate |
| HR / Payroll | Moderate | Very High | Very High | High |
| Finance / Accounting | High | Strong | High | High |
| Security / IDaaS | High | Rapid | Low to Moderate | High |
| Productivity / Workflow | High | Strong (14% CAGR) | Moderate | Low to Moderate |
| Vertical SaaS (Mfg, Construction) | Very High | Emerging | High | Very High |
The mid-market stands out because DX urgency is high, while procurement is usually less rigid than in the enterprise. In plain English: buyers often want change, and they can still move. That makes the mid-market the most reachable starting point across many categories. Next comes the harder part – ranking these segments by demand, buyer fit, and localization cost.
A Practical Framework to Find and Rank Japan SaaS Niches
Intuition is a weak filter in Japan. The market is structured, the buying process has more layers, and localization can get expensive fast. Picking a niche based on a gut feeling usually isn’t enough.
A scorecard works better.
It helps you rank segments based on buyer reality, not just market size. And in Japan, that distinction matters a lot.
Build a Segment Scoring Model for Japan
Score each segment across eight criteria, then weight each one based on how much it matters in Japan: pain urgency (20%), budget availability (15%), proof of value (15%), localization effort (10%), channel access (10%), implementation risk (10%), expansion potential (10%), and local trust and references (10%). This shifts the model away from pure market-size thinking and closer to how buying decisions happen on the ground.
Two criteria need extra care in Japan.
Local trust and references should carry more weight than they might in a U.S.-style model. Japanese buyers often want local case studies, Japanese-language documentation, and clear signs that a vendor is committed to the market before they take an evaluation seriously.
Channel access also matters more than many teams expect. Roughly 70% of B2B SaaS sales in Japan go through indirect channels such as Systems Integrators (SIers), VARs, and resellers. If no SIer or reseller is willing to test a partnership in that segment, the score should drop.
Localization effort also needs a close look. This isn’t just about translating the UI. It also means adjusting for Japan-specific workflows like invoicing formats, approval chains, and payroll rules. If a segment needs deep workflow changes, it should score lower here, unless pain urgency and budget are strong enough to offset it.
| Criterion | Weight | What to Measure in Japan |
|---|---|---|
| Pain Urgency | 20% | Is it tied to DX mandates or labor shortages? |
| Budget Availability | 15% | IT spend by segment; SME subsidy eligibility |
| Proof of Value | 15% | Local case studies, Japanese-language testimonials, adjacent vertical references |
| Localization Effort | 10% | UI, docs, workflows, compliance (reverse-scored) |
| Channel Access | 10% | SIer or VAR appetite for the category |
| Implementation Risk | 10% | Legacy integration complexity (reverse-scored) |
| Expansion Potential | 10% | Adjacent segments, upsell paths |
| Local Trust and References | 10% | Certifications, local logos, reference willingness |
Data Sources That Combine Demand and Buyer Reality
After you score the market, validate it with Japan-specific demand and buyer data.
For market size and growth, use Japan-based cuts from METI digitalization surveys for pain urgency and SaaS adoption rate, IDC Japan and Fuji Keizai for market size and growth by segment, and Teikoku Databank for firm counts and corporate health by industry. These sources give you a better read on Japan than top-down global estimates.
For buyer sentiment and category demand, ITreview and BOXIL are the local review platforms that matter most. Review text can show recurring objections and the words buyers use when they talk about the category. Japanese business and tech outlets such as Nikkei and ITmedia can also show which sectors are investing and where DX projects are slowing down.
Japanese keyword search patterns add another layer. Terms like クラウド人事システム (cloud HR system) or EC在庫管理システム (e-commerce inventory management system) can be tracked with SEO tools to estimate interest volume and see the language buyers use when they look for products.
Demand data only tells part of the story. Qualitative input matters just as much. Structured buyer interviews – 15–25 Japanese-language interviews with IT, business, and procurement buyers – help you see how decisions are made, which stakeholders are involved, and what documents buyers expect. Conversations with SIers and resellers add a deal-level view: where they see live interest, what usually blocks a sale, and what proof helps move a buyer ahead.
Turn Ranked Segments Into a Decision-Ready Shortlist
Once you’ve scored the segments, cut the list from six to eight candidates down to three to five that are ready for a go/no-go call.
For each segment that stays on the list, confirm five things:
- Who buys: roles and personas
- Why they buy now: the pain point and urgency driver
- How they buy: the approval chain and sales cycle length
- What blocks adoption: localization gaps, integration complexity, and trust barriers
- What evidence supports near-term entry: local case studies, inbound signals, SIer interest, and pilot data
If you can’t answer all five clearly, that segment needs more work.
The strongest candidates usually start with a narrow first use case, not a full platform rollout. That means one localized workflow, one defined buyer persona, and a realistic path to a reference customer in the first six months. From there, that first reference customer becomes the base for competitor mapping and go-to-market fit.
Competitive Mapping, Buyer Needs, and Go-to-Market Fit
Once you have a shortlist of segments, the next move is to see who you’re facing and what it will take to win in each one.
Map Rivals and Position for Japan-Specific Buying Criteria
Look at both domestic incumbents and global vendors active in Japan. But don’t judge them on feature lists alone. In Japan, buyers often care more about localization depth, support quality, local integrations, trust, and procurement readiness. In risk-averse categories, those factors can matter more than feature parity.
Domestic firms like Cybozu, Sansan, and Money Forward often lead in categories where workflow fit matters most, including HR, accounting, and approval-based processes. Global players like Salesforce and Microsoft are active too, but they face the same pressure to prove localization depth and local credibility.
When you build a rivalry matrix, compare each competitor on points like these:
| Criterion | What to Look For |
|---|---|
| Localization depth | Full UI and docs localization vs. partial or machine-translated; Japan-time-zone coverage, Japanese-language agents |
| Local integrations | Connectivity to Yayoi, freee, Money Forward, SmartHR |
| Local proof | Japanese case studies, recognizable local logos, ISO/ISMS certs; ratings and reviews on ITreview and BOXIL |
| Procurement readiness | JPY invoicing, hanko support, Japanese contracts, local entity |
The weak spots in this matrix are where positioning starts to get interesting. If a leading rival has strong features but weak localization, no Japanese customer success team, or thin local proof, that can be a real opening. This matters even more in segments where buyers do a lot of internal research before they ever talk to a vendor.
Use those gaps to decide which segments are winnable, not just which ones look good on paper.
Match Each Niche to Buyer Needs, Channel Fit, and Pricing Cues
After that, connect those rivalry gaps to how buyers purchase, what they expect to pay, and which channel makes sense.
Buyer behavior shifts a lot by segment size. Enterprise buyers usually run formal procurement cycles with multi-level ringi approvals. Mid-market buyers tend to move with a smaller group and less drag. SMB buyers care most about simplicity and fast onboarding. That choice shapes how fast you can land a first reference customer and how much localization work you need before launch.
List prices in Japan usually sit below U.S. levels, and the 10% consumption tax is normally shown separately as 税抜. Annual contracts are the norm. For enterprise procurement, bank transfer (furikomi) support is a must.
| Segment | Buyer Type | Channel Fit | Pricing and Contract Pattern |
|---|---|---|---|
| Enterprise HR / Compliance | IT + HR + Legal + Procurement | Direct + SIer partner | JPY, annual, volume discounts; PoC first, then annual |
| Mid-market Operations | Dept. head + IT lead | Hybrid (inside sales + reseller) | JPY, tiered plans, clear tax display; annual, sometimes monthly |
| SMB Self-Serve Tools | Owner or manager | Product-led / self-serve | JPY, per-seat or usage-based; monthly, easy cancellation |
Choose the Right Sales Motion for Each Segment
Your sales motion should match the buying process. If the buying path is formal, the sales approach has to be formal too.
For enterprise segments, high-touch field sales is structurally required. Product-led selling usually won’t make it through formal approval without a human champion pushing it along internally.
For mid-market segments, a hybrid motion tends to work well. Inside sales can handle discovery and demo, while a local reseller or SIer adds implementation credibility and trust. Your inside sales team should be native-speaking and armed with ringi-friendly materials: ROI templates, Japanese-language case studies, and security documentation that the buyer’s champion can pass around inside the company.
For SMB segments, product-led or self-serve can work – but only if the product experience is fully localized. A Japanese UI, clear JPY pricing, and fast onboarding cut friction and reduce the need for a sales rep. In some niches, like accounting or POS, light partner support from accountants or local IT shops can still help. But the core motion should stay simple and low-friction.
Across all segments, Japanese case studies and comparison pages can do a lot of heavy lifting. Buyers share them internally during evaluation. A clear comparison page that shows 月額/年額 options, cancellation terms, and local reference customers can help move a deal forward. Localization partners like Nihonium can prepare Japanese collateral, sales decks, and approval-ready documentation before outreach. Those assets should be ready before outreach starts.
Launch Order by Segment and the Entry Plan
Choose the First Segment Based on Proof, Speed, and Reference Value
The first segment you enter in Japan sets the tone for everything that comes next. A ranked list is useful, but it doesn’t decide the launch order on its own. You need a tighter filter.
Use three checks to sort the best first move:
- Is there already clear demand?
- Can you get to a paid pilot fast?
- Will those early wins turn into local references buyers will trust?
Launch first only when at least 60% of interviewed buyers confirm the need and at least two mid-tier SIers agree to pilot.
Stage Localization and GTM Work Around the First Segment
Once you’ve picked the first segment, localization should match that segment’s buying flow, not try to cover every use case at once.
Start with the items that affect conversion most:
- Japanese UI for core screens
- A Japanese pricing/contact page
- Ringi-ready collateral
- Onboarding emails
- JPY billing with bank transfer support
This lean localization package usually costs $15,000 to $30,000. That’s often enough to test product-market fit before going all in on full localization, which can cost $50,000 to $250,000.
Put APPI documentation and security questionnaires near the top of the list before broad outreach. In Japan, those materials often matter early in the buying process.
Early customer reviews on platforms like ITreview and BOXIL also help build the trust signals Japanese buyers look for.
More in-depth localization – like sector-specific UX, advanced integrations with domestic platforms, and full help center translation – can wait until early customers show you what they care about most. That way, you’re not spending money in the dark.
Nihonium can support this stage with localization, funnel setup, and fractional sales support.
With the launch stack in place, the next step is to line up nearby segments that can use the same motion.
Conclusion: A Simple Model for Picking and Sequencing Japan SaaS Niches
The model is straightforward: score the segment, check buyer pull, match the channel, then launch the narrowest viable wedge.
From there, expand into adjacent segments only when they can reuse the same core product, channel motion, and localized assets.
If a segment needs a different compliance model, a different channel plan, and a product rebuild, it’s too early.
Japan rewards depth before breadth. One well-run niche with local proof beats a broad launch with weak credibility.
FAQs
How do I validate demand in Japan before choosing a niche?
Go beyond desk research and test demand with a clear, step-by-step process.
Run 15 to 25 structured interviews in Japanese with likely buyers. Then move into pilots with 3 to 5 design customers. The goal is simple: swap guesses for proof before you commit to a full launch.
Use plain go/no-go signals to judge what you’re seeing, including:
- Pilot conversion rates
- Willingness to pay in yen
That way, you’re not betting on assumptions. You’re making the call based on what buyers say, what they do, and what they’ll pay in ¥ before you put serious money behind the effort.
Why is the mid-market often the best first target in Japan?
The mid-market is often the best first target in Japan. It gives foreign SaaS companies meaningful new demand without the full weight and complexity of enterprise sales. In plain English: there’s room to win deals here, without running straight into the limits that come with going too small.
With ACVs in the $10,000 to $100,000 range, this segment also fits a hybrid go-to-market motion. You can use product-led awareness to get on the radar, then rely on sales-led conversion to close the deal. That setup tends to work better in Japan than a pure self-serve model. It also gives new entrants time to build credibility and steady revenue before dealing with enterprise-level overhead.
What should I localize first to start selling in Japan?
Start with a phased Minimum Viable Localization approach.
That means you localize your landing page, core marketing materials, and a demo with a Japanese-language UI first. The goal is simple: test buyer interest and product-market fit before spending $50,000 to $250,000 on full localization.
If that early response looks good, then move into the full rollout. Localize the full UI, website, onboarding, and support docs. If you sell to enterprises, also localize sales materials, proposals, and contracts.
At that stage, your commercial setup should change too. Shift pricing and billing to JPY, offer annual contracts, and support bank transfers.
Related Blog Posts
- Top 5 Japanese Marketing Channels for B2B SaaS
- AI in Japan SaaS: Market Insights
- Channel Partners vs. Distributors in Japan SaaS Market
- 5 Customer Acquisition Tips for SaaS in Japan
 Japanese
 English